SAN DIEGO (KGTV) – A new statewide survey shows San Diegans support a sales tax increase to fund transportation projects but oppose taxing each mile driven.
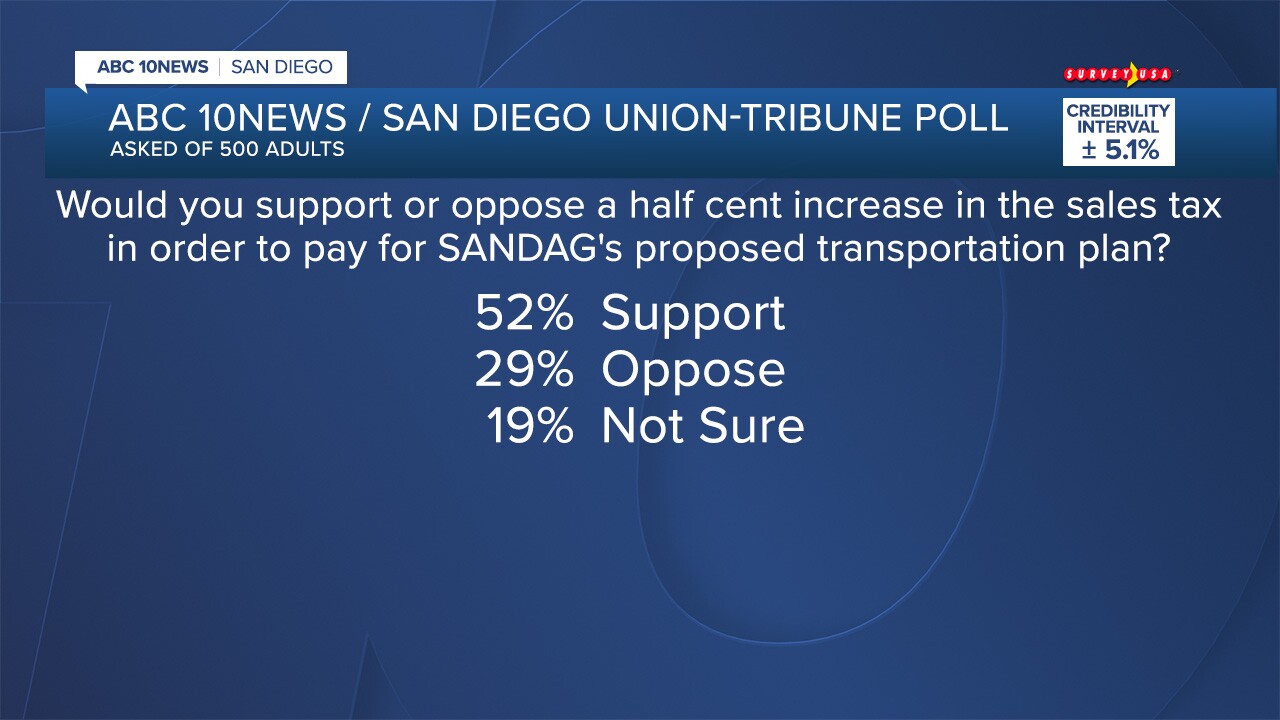
The ABC 10News/Survey USA poll of 500 San Diegans indicates that 52% of San Diego County adults would support a half-cent increase in the sales tax to pay for the San Diego Association of Governments (SANDAG) $160 billion Regional Plan. While 29% said they oppose the sales tax increase.
When asked about the idea of a tax on each mile driven, 60% of San Diegans opposed it while 23% supported it.

RELATED COVERAGE:
- What's inside SANDAG's regional plan and how it may impact you
- Road charge? SANDAG's per-mile driving fee faces opposition
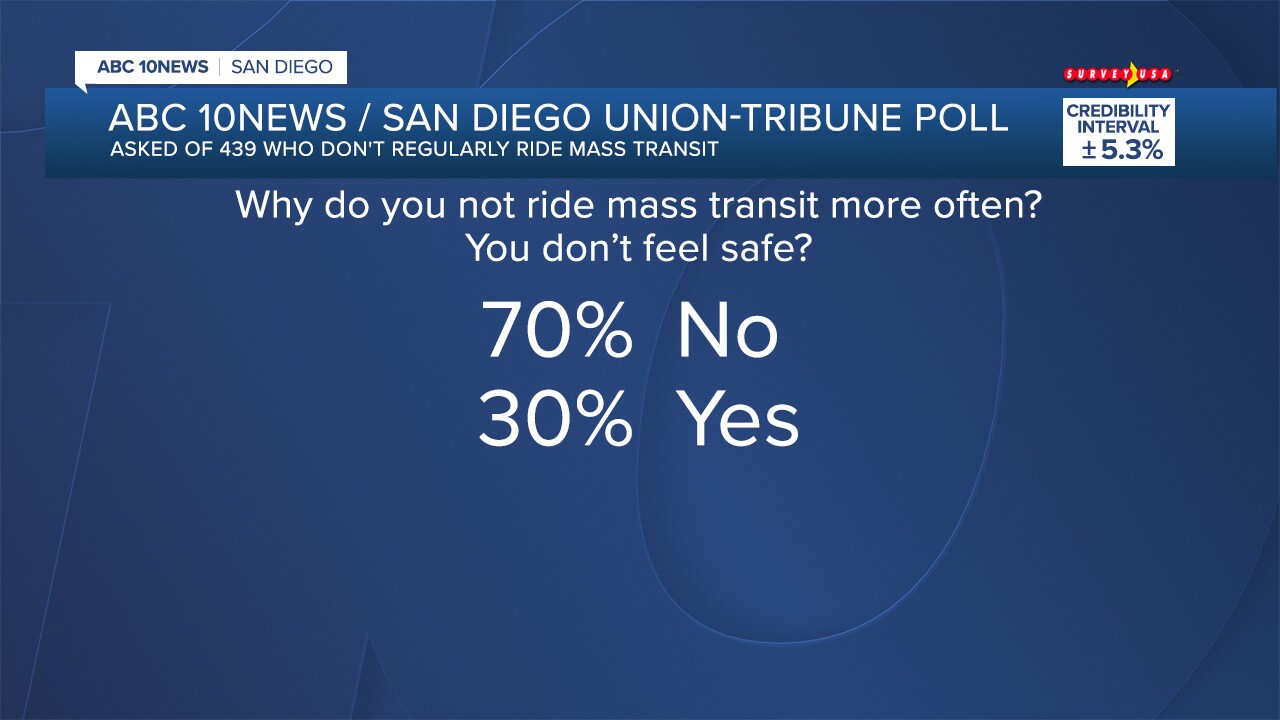
There were 37% of San Diego County residents said they would ride the trolley if it were free at least once a week, while 12% said they would ride it every day. Among those polled who ride public transit regularly, 88% percent said they would ride a free trolley at least once a week. Of those who rarely ride public transportation, 17% said they would ride a free trolley at least once a week.

Surveyors were then asked where they think the majority of tax dollars should be spent on mass transit: buses and trolleys, building new roads and freeways, expanding existing freeways, or something else. Of those surveyed, 22% said mass transit, 27% said new roads and freeways, 23% said expanding existing freeways, 10% said high-speed rail, 8% said other and 10% were not sure.

See results for other survey questions below: