

TUCSON, Ariz. (KGUN) — Droughts across much of the west are approaching record levels this summer, with big implications for water usage and wildfire risk.
Maps from the U.S. Drought Monitor -- a federal partnership of agencies and organizations charged with tracking drought conditions across the country -- show just how dry things have gotten in the West this year.
Animated Map: Week-by-week drought conditions for the U.S.

(credit: U.S. Drought Monitor)
Map: Drought conditions June 2020 (left) vs. June 2021 (right)

(credit: U.S. Drought Monitor)
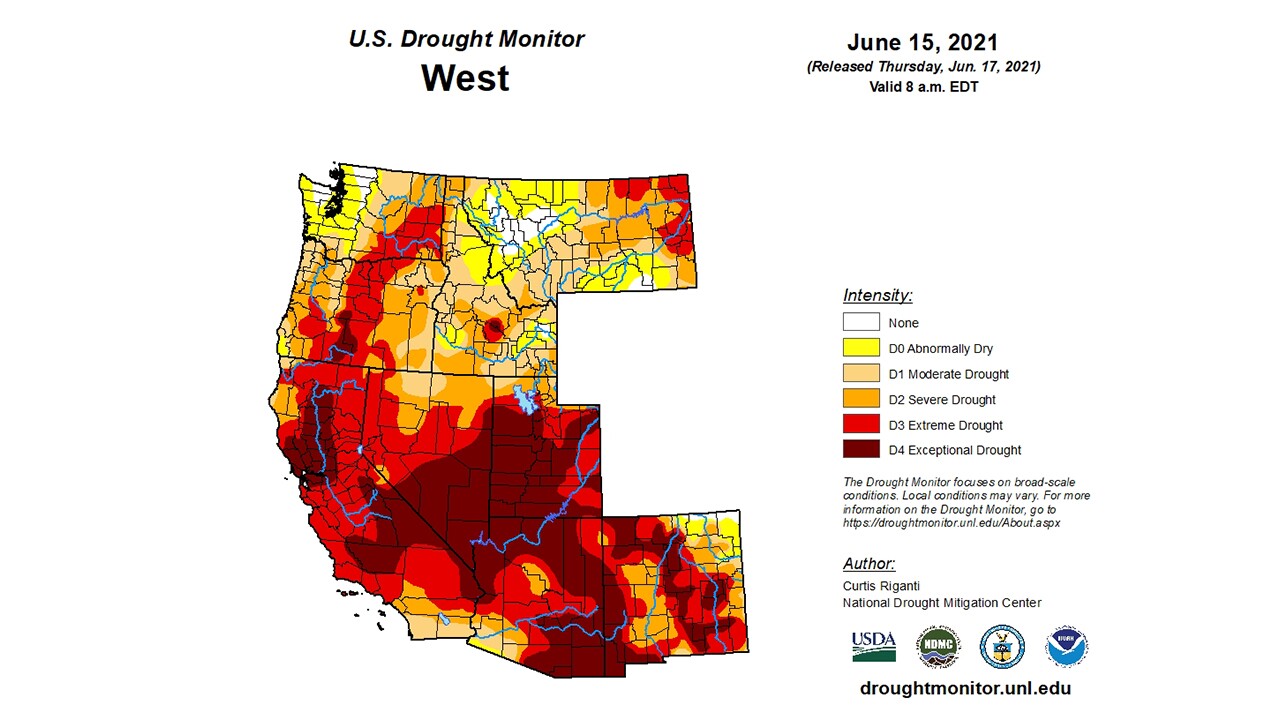
Map: Change in drought conditions in the western U.S. over the last 52 weeks

(credit: U.S. Drought Monitor)
Animated Map of San Diego County's two largest reservoirs: San Vicente Reservoir (left) and El Capitan Reservoir (right) (1984-2020)
You can view more maps on the U.S. Drought Monitor's website.
